32 games hold half of Steam
Of the 10,188 games Coilr counted players in over the last day, 32 of them held half of everyone playing. The median game had 5 players, and 2,989 had nobody in them at all.
Figures as of September 20, 2026 · updated daily
The shape of it
Steam is usually described as a store with a hundred thousand games in it. As a place where people actually are, it is much smaller than that. 4 games carry a quarter of all players, 32 carry half. By game 388 you have accounted for nine players in ten, and the remaining 9,444 games are splitting the last five percent between them.
Where each slice lands
Games needed, counting from the biggest down, to account for that share of all players. Bars are drawn on the same logarithmic scale as the chart above.
The split does not move
A single day could be an accident — a free weekend, a tournament, a launch. So here are 14 of them. Across those two weeks the number of players Coilr counted rose and fell by 28.8%, from 7,802,242 to 10,049,816. The number of games holding half of them stayed between 25 and 35, and the thirty biggest games held between 47.7% and 53.3% every single day. Steam got bigger and smaller; it never got flatter.
The fourteen curves in the first chart say the same thing more strictly. At no point along them — not at rank 1, not at rank 10, not at rank 1,000 — do the highest and lowest days differ by more than 6.1 percentage points. Whatever decides this shape, it is not something that changes week to week.
The games at the top
The ones doing the holding, on the most recent day measured.
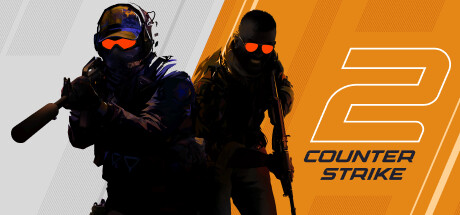
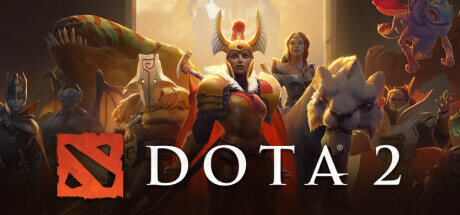










Share is of all players counted that day.
Two things this is not
It is not an artefact of what Coilr tracks. The obvious objection is that we simply miss small games, which would make Steam look more concentrated than it is. The opposite risk is the real one. We counted 10,188 games over the last day and 2,989 of them — nearly a third — had exactly zero players. The median game had 5. Adding more games to the denominator can only push the concentration higher, because the games we are not watching look like the ones at the bottom of the list, not the ones at the top.
It is not a claim about sales. This counts people playing, not copies bought. A game can sell extremely well and appear far down this list because its players finished it and moved on. Concentration of attention at a moment and concentration of revenue over a lifetime are different things, and only the first one is measured here.
Method
Coilr records the number of people in a game from Steam’s own live player counts. The busiest games are re-read every ten minutes; the long tail comes round roughly once a day. A day is therefore the shortest window that sees the whole catalogue, and each game enters a day at its most recent reading inside it.
That choice has a cost worth stating plainly. Because each game is counted at its own last reading rather than at one shared instant, the daily total is a population rather than a headcount at a moment: it is slightly higher than the number of people on Steam at any one second. It does not affect the shape, which is what this report is about — every game in a day is measured the same way, so the ranking and the shares are consistent. A narrower window would buy a cleaner instant at the price of dropping nine thousand games, which would overstate exactly the thing being measured.
“Half” means the smallest number of games, counting from the biggest down, whose players add up to 50% or more of that day’s total. Games with no players still count as games; they sit at the bottom and contribute nothing, which is the point.
Using this
Free to quote and republish with attribution to Coilr. Recomputed daily, so cite the date above. See also: when Steam is busiest.