Coilr report·Prices·
Past twenty dollars, every step up in price costs a Steam game review points
Coilr tracks the regular price and the review score of most of the Steam catalogue. Put the two together across 5,111 paid games that have at least 1,000 reviews each, and the relationship is not the one you would guess. Below about twenty dollars, price barely matters: the cheapest eighth of games average 83.3% positive and the middle of the range sits within a point of that. Above it, the line only goes one way — down to 80.4% for the most expensive eighth, which averages $46.84.
The gap between the best-reviewed band and the priciest is 6.1 points, and it straddles a line Steam actually draws. The store labels a game “Very Positive” at 80% and “Mostly Positive” below it: the $10–20 band averages 84.6% and lands on one side, the $50-and-up band averages 78.5% and lands on the other.
84.6%
positive in the $10–20 band — the best of any price
78.5%
positive at $50 and up, across 155 games
5,111
paid games with 1,000+ reviews behind the figures
Score by price
Paid games only, each with at least 1,000 reviews. Price is the regular US price, not today’s discounted one — otherwise a game would drop a band for the duration of a sale.
Share of reviews that are positive, and the number of games behind each bar. The axis starts at 70% rather than zero: every band sits between 70 and 90, and a zero-based axis would compress the entire finding into the last tenth of the chart.
Equal-sized groups, in case the bands did the work
Band edges are a choice, and a choice can manufacture a trend. Splitting the same games into eight groups of equal size instead removes that freedom, and the shape survives: flat to about twenty dollars, then a steady decline.
Average regular price of each eighth, against its average score.
Half of the obvious version of this chart is an illusion
Run the same query without an audience floor and the curve grows a second arm: very cheap games appear to review badly too, which turns the finding into a tidy story about a sweet spot in the middle. That arm is not real.
With no floor, games under $10 average 77.5%. Ask only for games that have cleared 1,000 reviews and the same band averages 83.6%. The cheap end of the catalogue is where games with a few dozen reviews live, and a few dozen reviews is not a score, it is a rumour. Split the whole thing by audience size and the point is unmissable: under $10 with 50 to 200 reviews averages 67.3%, while under $10 with more than ten thousand reviews averages 90.3% — the highest figure anywhere in this report. In that same well-reviewed group, $30-and-up games sit at 82.7%.
| Audience | Under $10 | $10–20 | $20–30 | $30+ |
|---|---|---|---|---|
| 50–200 reviews | 67.3236 | 69.638 | — | — |
| 200–1,000 | 69.5932 | 74.6311 | 70.151 | — |
| 1,000–10,000 | 82.21,342 | 83.01,421 | 81.4526 | 77.2272 |
| 10,000+ | 90.3271 | 88.6563 | 86.2341 | 82.7375 |
Score, then the number of games, for each price band within each audience size. Cells with fewer than 20 games are left blank rather than printed as if they meant something. Read down a column: the expensive arm of the curve is present in every row that has enough games to judge. Read across the bottom row: the cheap arm is not.
The best-reviewed games on Steam are cheap ones with big audiences
Under $10, more than ten thousand reviews. This is the corner of the catalogue the uncontrolled chart hides.






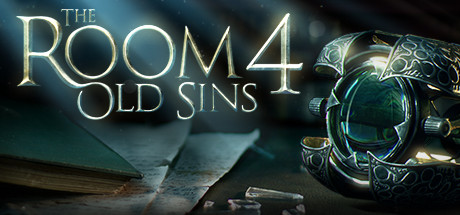

And the top of the price list
Every paid game in the sample at $50 or more, by price. Some are excellent; the band average is still the lowest on the chart.







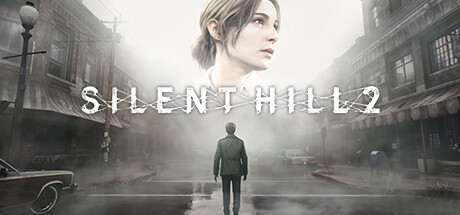
What this is not
It is not evidence that charging less makes a better game. Price is bound up with everything else about a release: budget, marketing reach, how broad an audience the game is sold to, and how much a buyer expects for their money. A $60 game is bought by people who were persuaded by an advertisement; a $9 game is mostly bought by people who already wanted it. That difference alone could produce this entire chart, and nothing here can separate the two.
What the numbers do settle is the direction. Whatever the mechanism, the expensive end of Steam is reviewed worse than the cheap end, it is worse at every audience size big enough to measure, and the effect is large enough to move a game between the labels Steam prints on a store page.
Free-to-play games sit outside this entirely and are excluded from every figure above. For the record they average 75.7% across 1,506 games, with 20,933 reviews apiece — the widest, least self-selected audiences on the platform.
Method
Every game where Coilr holds both a US store price and a review summary, as of October 5, 2026: 8,210 games with at least 50 reviews, of which 5,111 are paid and clear the 1,000-review floor used for the headline figures. Score is the share of all reviews that are positive, as Steam reports it.
Price is regular price — Steam’s `initial` price, before any current discount — so a game does not move between bands for the length of a sale. Only the US store is used; mixing regional prices would compare converted figures against real ones, and Steam’s regional pricing is not a straight conversion.
Games are weighted equally, not by review count. Weighting by reviews would let a handful of enormous releases decide each band, which is the opposite of what this report is asking.